4. Tests, Metrics & Reports
Attention
This section is very outdated (late 2014)! It will be re-written based on jupyter notebooks.
For now, launch the demo server(![]() ), open & run the
), open & run the CarsDB-compare.ipynb notebook,
and start comparing vehicles between AccDB <–> PyAlgo, interactively:
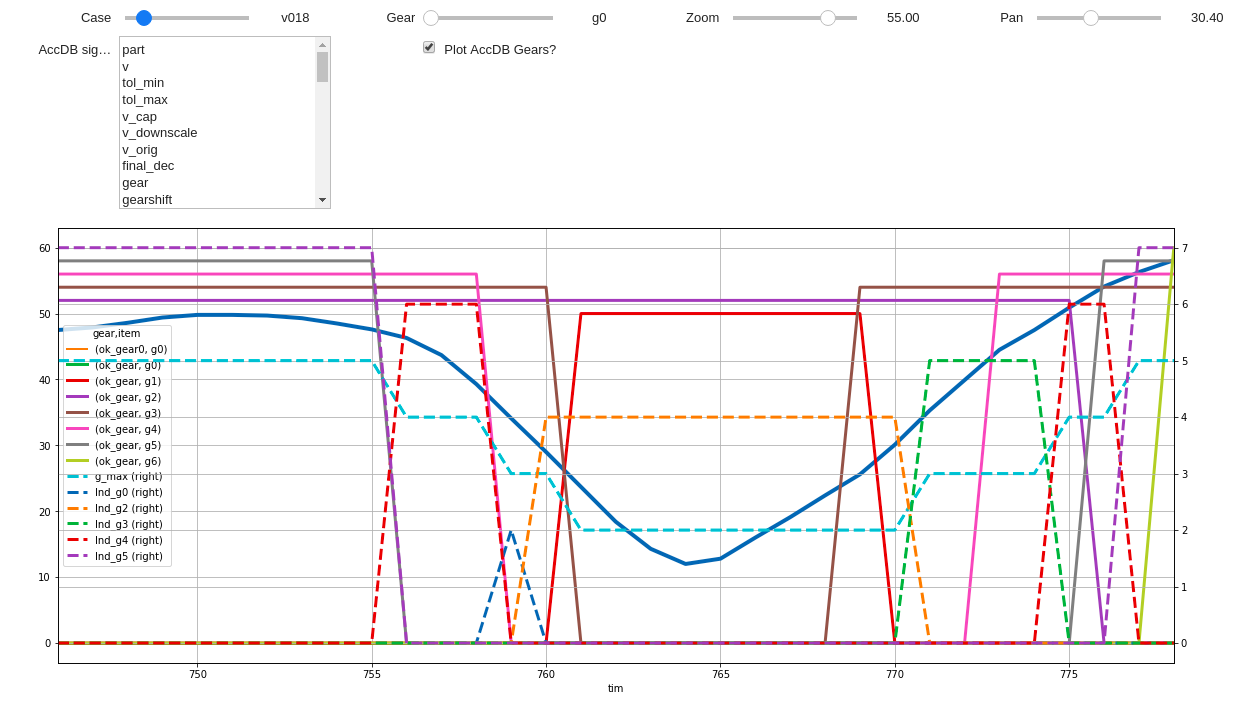
In order to maintain the algorithm stable, a lot of effort has been put
to setup a series of test-case and metrics to check the sanity of the results
and to compare them with the AccDB tool or other datasets included in the project.
These tests can be found in the /tests/ folders.
Additionally, below are auto-generated representative diagrams with the purpose to track the behavior and the evolution of this project.
You can reuse the plotting code here for building nice ipython-notebooks reports,
and (optionally) link them in the wiki of the project (see section above).
The actual code for generating diagrams for these metrics is in wltp.plots and it is invoked
by scripts in the docs/pyplot/ folder.
4.1. Comparisons with AccDB
This section compares the results of this tool to the MS Access DB.
4.1.1. Mean Engine-speed vs PMR
First the mean engine-speed of vehicles are compared with access-db tool, grouped by PMRs:
Both tools generate the same rough engine speeds. There is though a trend for this project to produce lower rpm’s as the PMR of the vehicle increases. But it is difficult to tell what each vehicle does isolated.
The same information is presented again but now each vehicle difference is drawn with an arrow:
It can be seen now that this project’s calculates lower engine-speeds for classes 1 & 3 but the trend is reversed for class 2.
4.1.2. Mean Engine-speed vs Gears
Below the mean-engine-speeds are drawn against the mean gear used, grouped by classes and class-parts (so that, for instance, a class3 vehicle corresponds to 3 points on the diagram):